words by Evan Thayer
For the past 9 years, I’ve been writing forecasts detailing when and where to find Utah’s plentiful deep powder days through Wasatch Snow Forecast and OpenSnow.com. Today, we are going to take a look at how anybody with internet access, a curiosity to learn and a passion for Utah snow can use some of the same tools I use to make their own snow forecasts.
For the past 9 years, I’ve been writing forecasts detailing when and where to find Utah’s plentiful deep powder days through Wasatch Snow Forecast and OpenSnow.com. Today, we are going to take a look at how anybody with internet access, a curiosity to learn and a passion for Utah snow can use some of the same tools I use to make their own snow forecasts.
Step 1 – Know the Terrain
Firstly, you need to know the terrain. Most weather model outputs are in map form. I know it’s shocking, but most maps used by these models do not have the ski areas on the map. This means that you need to know where on the map each resort is located. Obviously, if there are cities on the map, you can use this as a reference point. For me, I know the general location in relation to the Great Salt Lake, which is almost always displayed on forecast maps. Because most Utah resorts are within an hour of the GSL, it makes identifying general locations fairly easy. Last year, I used county lines to approximate locations of resorts, and then created an overlay to use for model outputs. This allows me to easily demonstrate which resorts are favored to get snow. Here is an example from our storm earlier in October:
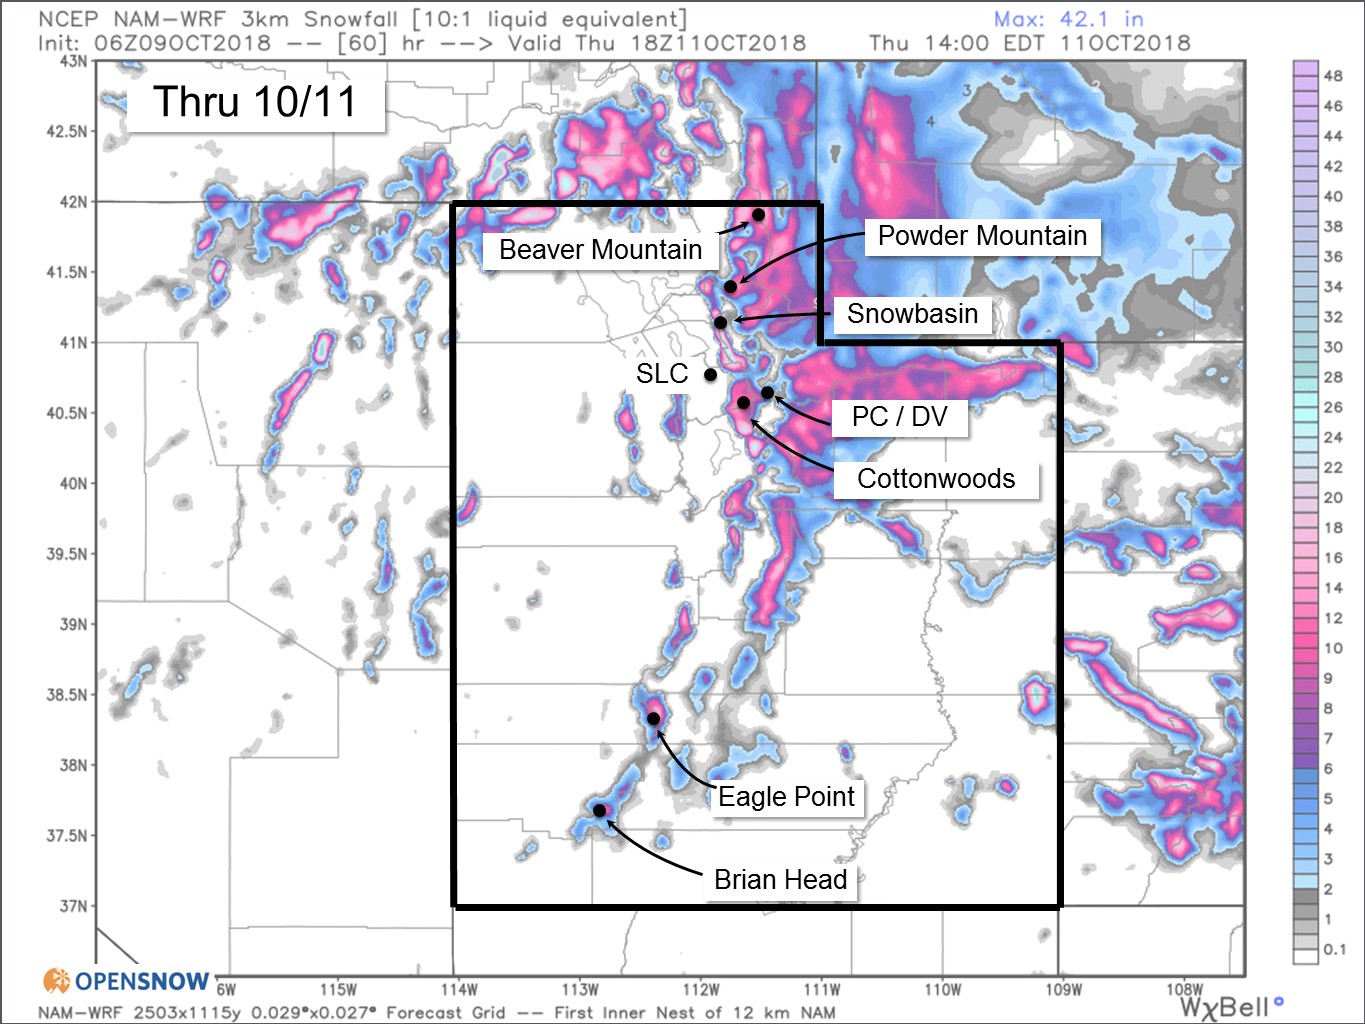
Knowing these locations allows me and my readers to better interpret these maps.
The second part of knowing the terrain is knowing what type of storms favor which resorts. Generally speaking, precipitation (rain/snow) are generated with “lift,” air rising in the atmosphere. When winds blow into the windward side of mountains, it forces the air to rise, condense, and then fall as rain or snow. In the case of Utah in the winter, it’s almost always snow. This terrain-driven lift is referred to as orographic lift or enhancement. Because of this, wind direction in the atmosphere is a critical factor to determine which areas see the most snow in a storm. For example, areas that often do well in flows from the southwest are Sundance, Deer Valley Resort, Brighton, and Snowbasin Resort. Similarly, Snowbird and Alta Ski Area in Little Cottonwood Canyon famously do well in a northwest flow, which is our most predominant pattern in Utah. Using the below graphic from University of Utah professor, Jim Steenburgh’s book Secrets of the Greatest Snow on Earth, we can see different flows and their effect on the central Wasatch:
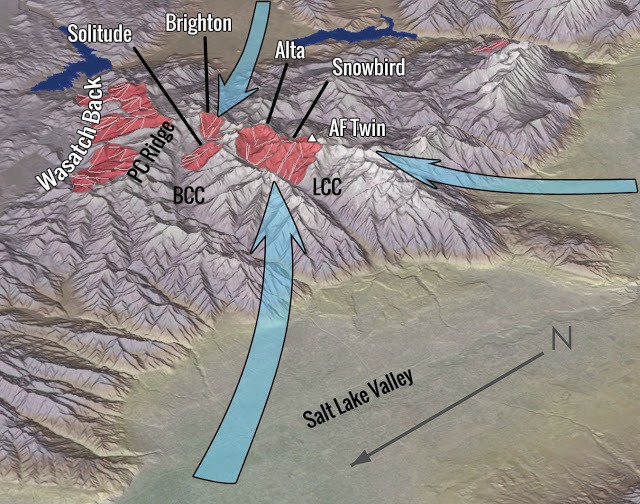
The top arrow in the image demonstrates a southeasterly flow. This occurs typically when low-pressure systems spin counterclockwise to our south, forcing winds from this direction. This favors the Wasatch Back such as Deer Valley and Park City. Southwest flows are demonstrated by the arrow on the right. The northwest flow is the bottom arrow. You can see how lift is generated by the mountain terrain and dumps right on Little Cottonwood Canyon. This is also the type of flow that can bring lake-effect snowfall from the Great Salt Lake.
Knowing how storms will behave based on terrain is a very difficult science with a lot of variables. While you can easily learn the basics, there is no substitute for experience. The more time you spend studying storms, the better you will be able to predict which resorts will do the best in each storm.
Step 2 – Using Weather Models
The next step in making your forecasts might be the most obvious – use the weather models. Here in the United States, the weather models are generally publicly funded through your tax dollars. In order to get the most out of your own tax money, you should be benefitting from the weather models that are publicly available. My favorite location to access the American suite of weather models is through the National Centers for Environmental Prediction (NCEP). Through the NCEP’s website, you can access the GFS (medium to long range) and the NAM (short range) models. The European model (ECMWF) is also available on other websites, however, most of its outputs are not free-to-use and therefore often behind a paywall.
Once you have access to models, you have to know what to look for. The most important things when forecasting snowfall for a specific location is forecasted precipitation (QPF) and temperature. QPF is important because it is how much liquid we expect to fall. Temperature is important because it not only influences the snow level, but also the snow-to-water ratio needed to convert liquid amounts into inches of snowfall. Let’s look at the following example:
Let’s say you look at a forecast model and see that one inch of liquid (QPF) is forecasted to fall at Alta in a storm. You can then look at the temperature outputs from the model during this storm period. For this, you generally check the temperature forecasted at 700mb of atmospheric pressure. This is generally around 10,000-11,000 feet in elevation. Based on the temperature at this elevation, you can make estimates on snow ratios. If the temperature at 700mb is warmer than -5C , then you can expect a warm storm. This would mean snowfall ratios of 10:1 or less -- which means less than 10 inches of snow from this one inch of QPF. However, 700mb temperature of -5C to -10C is a more typical storm for Utah. That means ratios of 10-15 to one, that would mean 10-15” of snow. Then, a temperature of -10C or less would be a colder storm. That would mean snow ratios of 15-20+ to one. Or more practically, 15-20+” of snow per one inch of liquid. This is the lightest and fluffiest snow. Blower pow!
It may sound complicated, but once you get used to the math, this rule generally holds true – and makes forecasting snowfall a breeze. But why make these calculations yourself when you can let tools developed by meteorologists do the math for you?
The University of Utah Atmospheric Sciences program has developed a great page for forecasting snow both here in Utah and other locations across the Western US. This page can be accessed at weather.utah.edu. My two favorite tools on this page are the NAEFS ensemble plumes and the GFS and NAM meteograms. The ensemble plumes, shown below, take all the ensembles that make up the GFS and Canadian forecast models and put them into graphical form.

This is from the storm earlier this month. The top graph shows the QPF (liquid forecasted) and the bottom graph uses temperature to calculate snow amounts based on the ratios derived from the temperature. You can see that the GEFS mean (red line) shows just over an inch of liquid on the top graph and just over 10 inches of snow on the bottom graph. That means that this storm had about 10:1 ratios. This would be a relatively warm storm in mid-winter, but not too bad considering this was early October.
The other tool I like to use is the 12km NAM meteogram. This is similar in concept to the above graphs, but from a high-resolution short range model instead. Here is the NAM from the same storm earlier this month:
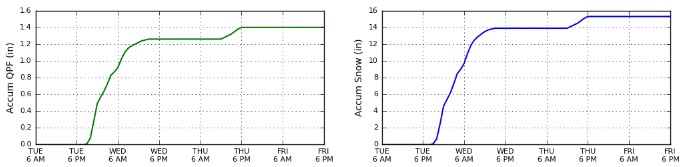
You can see we also have QPF on the left showing about 1.2 inches of liquid. Then we have that automatically converted to snow amounts on the right – about 14 inches. Again, that equates to just over 10:1 ratios. You can see why these are useful tools provided by the University of Utah. If you’d like to learn more about the tools available on this page, you can read Jim Steenburgh’s recent blog post.
Step 3 – Timing is Everything
The final step in making your forecast is to get the timing right, from both a technical and practical perspective. Technically, it is important to remember that many of the models forecast in UTC (z) time, which runs 7 hours ahead of Utah during the winter. If you look at a model and it shows heavy precipitation falling between 00z and 06z on Wednesday, that would actually be 5 pm to 11 pm on Tuesday evening here in Utah. Practically, you also have to know how the snow at certain times will affect the ski conditions and plan accordingly. There is a tendency for skiers to hear that it is going to snow a lot on one day and then instinctively make plans to ski the day after. But this is a broad generalization, if the snow arrives early in the day, you better get after it day of, or else you will be late to the game if you arrive the next day expecting untracked powder. Conversely, often people hear it is going to snow a lot on one day, so they show up early in the day, but the snow has yet to arrive. There are some days when last chair is the best chair, and knowing the exact timing of storms helps you to avoid the pitfalls of “powder panic.”
My last piece of advice is to forecast conservatively for yourself -- temper your expectations. It is far better to have low expectations and be pleasantly surprised than to expect huge snow totals and be disappointed. I find that Utah has a tendency to over-deliver more than anywhere else in the country. Despite that, I’ve managed keep my expectations in check with each storm. This allows me to stay positive during dry spells, and then really appreciate those storm cycles that bring day after day of deep powder. Luckily, here in Utah, we have plenty of storm cycles like that!
Evan Thayer | OpenSnow Utah Forecaster
P.S. If you’d like to learn more about the science behind snow here in Utah, I highly recommend purchasing Steenburgh’s book Secrets of the Greatest Snow on Earth. And if you've ever wondered why Utah has the Greatest Snow on Earth, read Utah's Goldilocks Effect.