words by Evan Thayer
Last October, when I wrote Part 1 of DIY Forecasting, I focused on forecasting individual storms within a week of their arrival. This operates on the assumption that the skier was already in Utah, or at least willing to travel to Utah on very short notice. However, the fact is that many of us need at least a bit more advanced notice to put in the necessary vacation requests, book flights, and prep our gear for The Greatest Snow on Earth. So, can you still chase powder if you need a week or two to plan the trip? The answer is yes, but it will take a bit more work than simply checking a weather app on your phone.
To figure out what the weather is going to be 7-14 days away from today, we first have to accept that this is an imperfect science. The chances of nailing down the specifics of a storm are low, and the chances of the forecast changing are high. Essentially, booking a powder chasing trip more than a week in advance is a gamble. However, this is a gamble that allows us to stack the odds in our favor. To do this, we have to try to predict the “synoptic pattern”. In meteorological sciences, we deal with scale. Synoptic is a fancy word for “large scale”. In the case of meteorology, synoptic or large scale refers to the overall patterns spreading hundreds or even thousands of miles. For example, if the Western US is under a large trough, or dip, in the jet stream, and simultaneously, the East Coast of the US is under a big ridge of high pressure – this would be an example of a synoptic pattern. On the other hand, a band of rain pushing through the Salt Lake Valley would be mesoscale (medium scale). A gust of wind or a single cloud would be microscale (small scale). Now that we’ve established that mesoscale and microscale details are impossible to predict more than a week out, we have to focus on synoptic scale.
In general terms, the synoptic pattern that brings Utah storms is a single trough, or series of troughs moving through the state and the intermountain west. The best way to identify troughs is to look at maps that show the forecasted atmospheric pressure compared to normal. These maps are typically referred to as “height anomaly” maps, because they look at the elevation (height) of specific pressure levels compared to average. The lower the heights, the better your chances for storms. (Instructions for accessing height anomaly maps below)
Accessing and reading outputs of forecast models can be tricky. Luckily, government entities such as the Climate Prediction Center (CPC) have done some of the heavy lifting for you. They analyze synoptic guidance daily to provide 8-14 day outlooks for the U.S.
For example, here is the 8-14 Day Outlook released on October 20, 2019. The forecast itself is for October 28 – November 3, 2019: 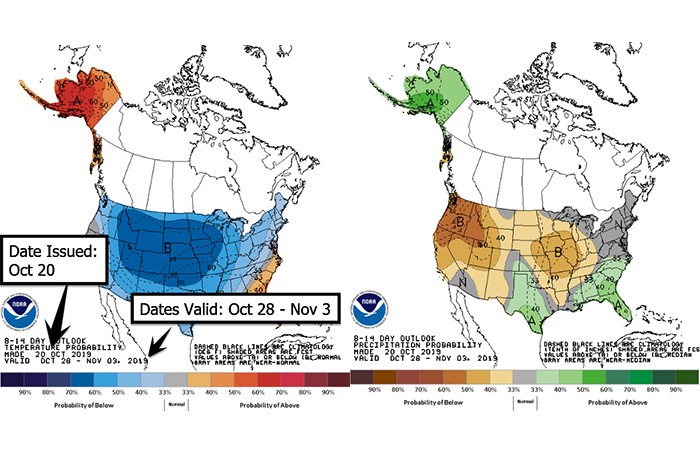
These maps can be on their website. The map on the left illustrates where there will most likely be below or above normal temperatures. The map on the right shows the likelihood of below/above normal precipitation during that period.
Sure enough, this forecast from October 20th came to fruition. Here is NOAAs forecast map for the entire country 9 days later (on October 29th ): 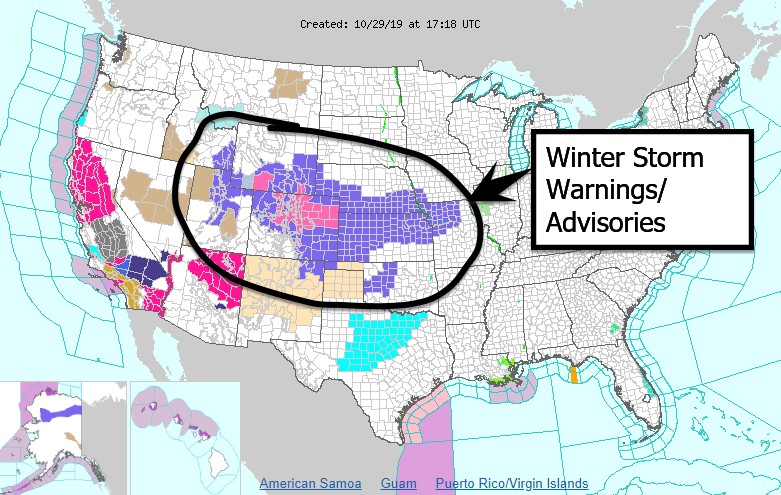
Notice the prediction of very cold weather across the central U.S. was correct. In fact, record cold is occurring.
As a general rule, if these maps show below-average temperatures and above-average precipitation, you can expect that there is a good chance that Utah will be getting snowfall during the specified date range. Time to book your flight or pack up your car and head to Utah! I highly recommend using these CPC maps to help you predict upcoming weather patterns.
Instructions to check forecasted height anomalies:
If you’d rather bypass the CPC maps and dig into the data yourself, you can absolutely access it on your own. To check to see if Utah will be under a trough, ridge, or somewhere in-between, I typically like to use GFS Ensemble Mean guidance. The GFS weather model is made up of dozens of ensembles, which are essentially instances of the model that weight inputs differently. The Ensemble Mean, is the average of all these ensembles. Using the mean of the ensembles is nice because it mitigates the effects of outlier ensembles by coming up with a consensus. Because GFS data is in the public domain, you can access GFS Ensembles in many locations, but I like to use the following:
Go to https://www.esrl.noaa.gov/psd/map/images/ens/ens.html
Scroll to the section titled “North America Plots”
Click “Animation” at the bottom of the “Ensemble Means” column
You should then see an image that looks like this: 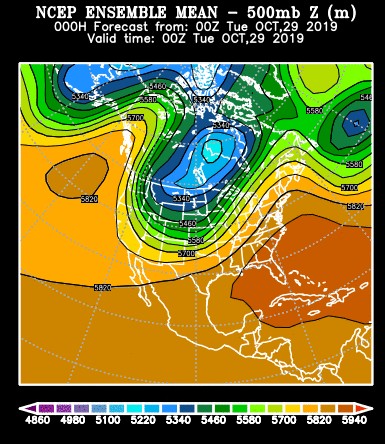
You can use the controls in the left pane to play the forecasted anomalies for the next 15 days. You can see in the above image that this is valid for October 29, 2019 – the same date as the NOAA map above. You can see the dip in the jet stream and deep trough over the central United States. When you see troughs over Utah and the western states, then you know there is a higher probability of winter storms impacting the region.
Predicting beyond 15 days:
While we continue to improve long-range forecasts, anything beyond two weeks is essentially impossible to forecast. If you book well in advance, you can take solace knowing that Utah is one of the snowiest places on the planet and we see consistent snow from November until April. There is a very good chance that you’ll be skiing fresh powder during your trip!
Did you miss DIY Forecasting Part 1? Read more here.
The Interconnect Tour
Ski up-to 6 resort in 1 day!
Ski Utah Snow Report App
From daily totals and weather to powder alerts and ski day counter.
Last Chair Podcast
Hosted By Tom Kelly
Ski Utah Passport
Available to any 4th, 5th and 6th grade student
The Ski Utah Store
Hoodies, Hats, T-Shirts and More!